
PG County Real Estate Trends + Proposed Property Tax Change
Prince George’s County is considering changes to its “municipal tax differentials” – the County property tax credit we as Laurel residents receive since we rely instead on our City for certain services (like police, trash pickup, & others).
Bottom line: They’re eliminating one credit, adding another, with a negligible net difference to Laurelites – so okay on that front.
But something I found interesting woven inside the report: Charts showing real estate trends for Prince George’s County. Sharing here, with my notes added:
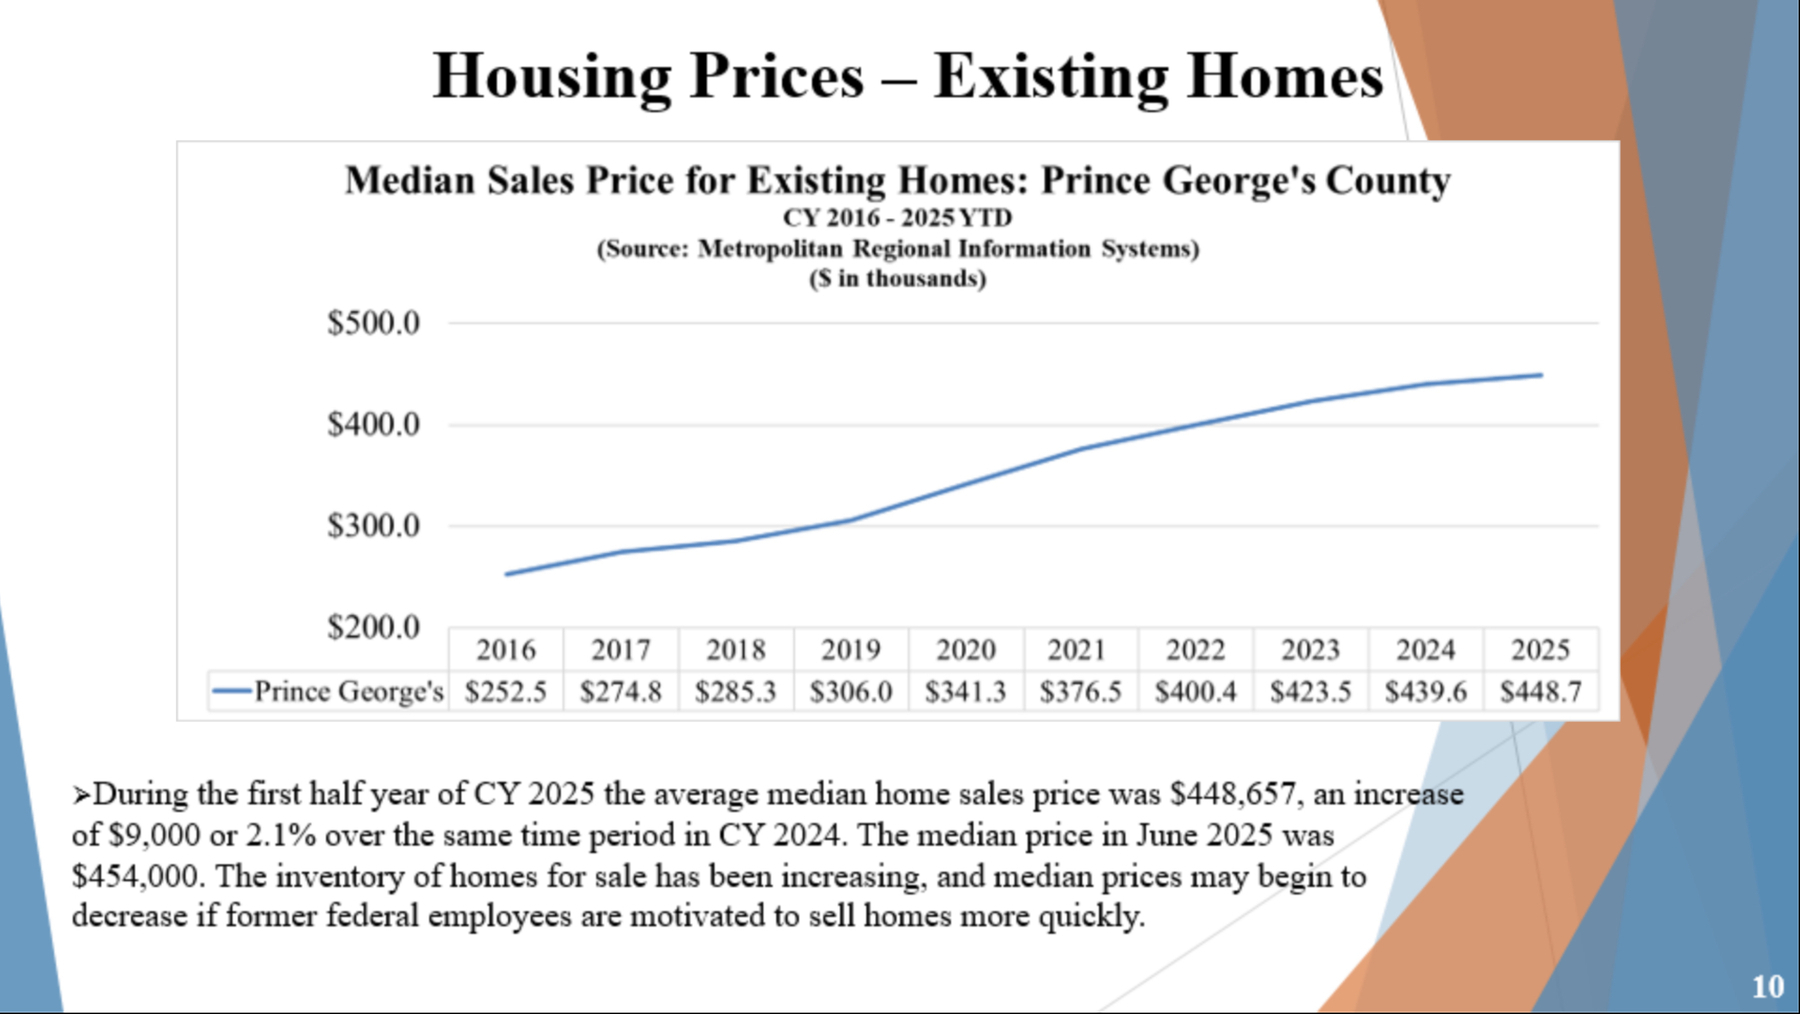
NOTE 1: The median sales price for existing homes increased from $252k to $448k between 2016 to 2025 – a 78% increase overall, and equivalent to a 6% increase per year.
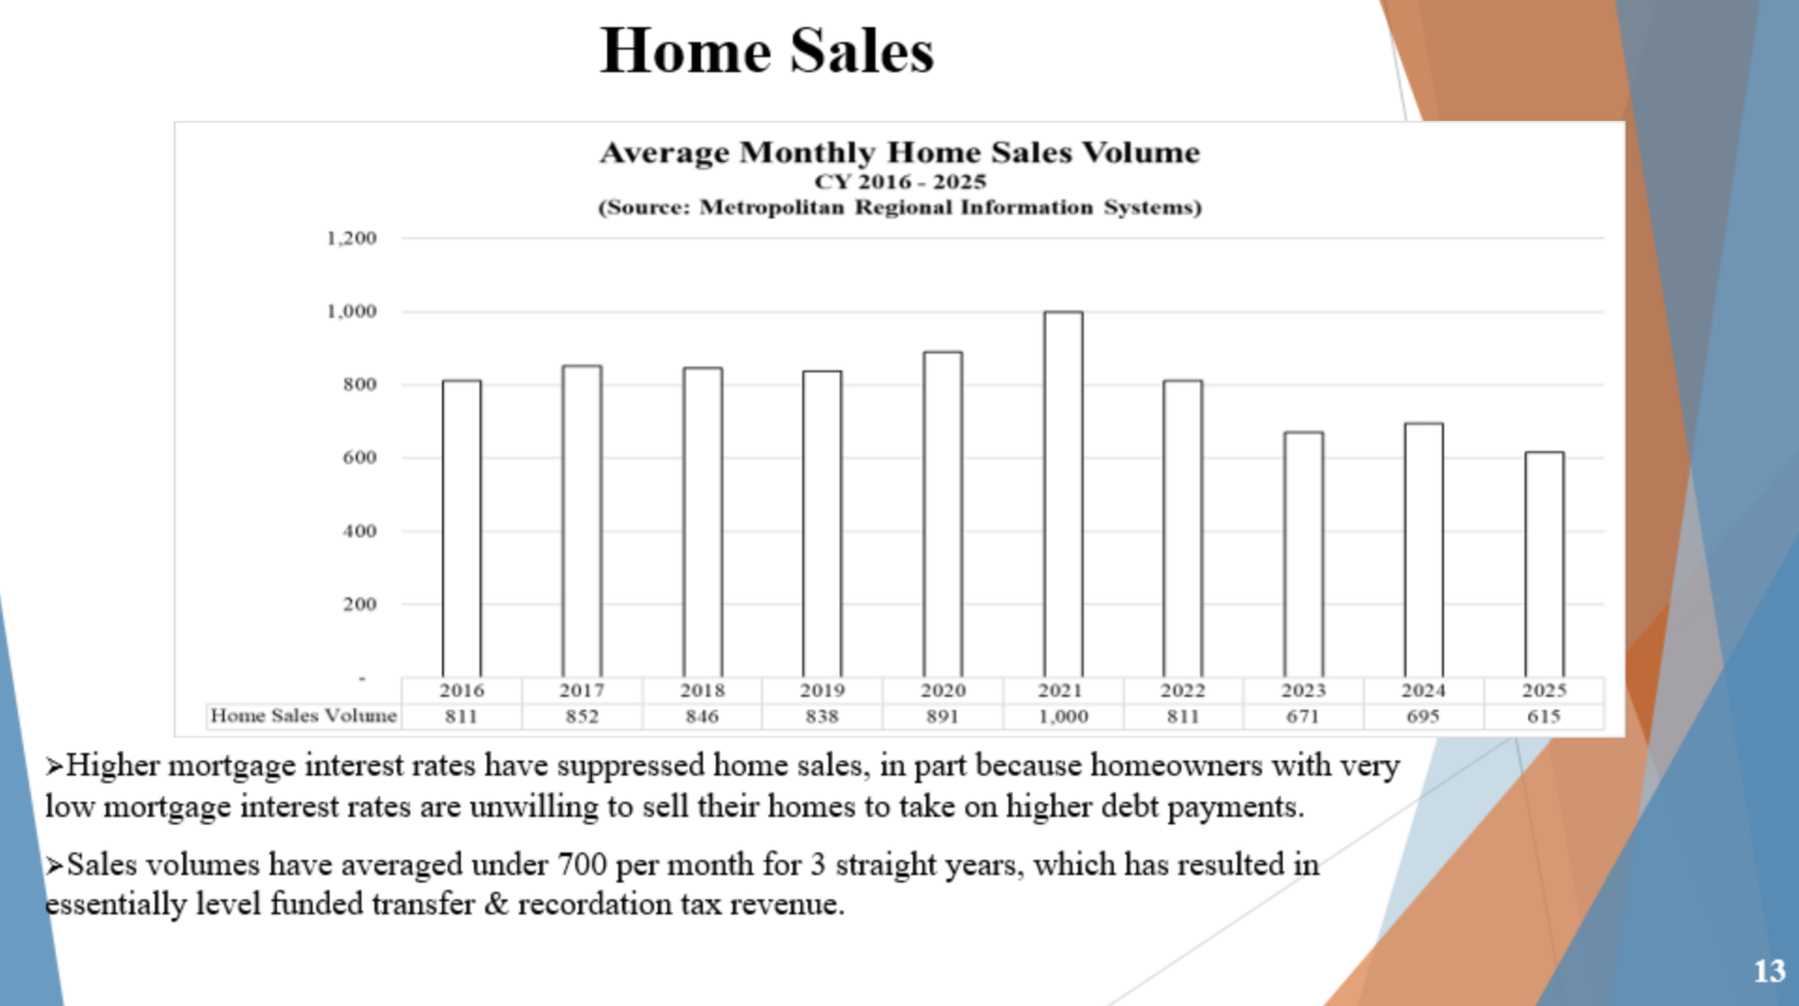
NOTE 2: Thus far in 2025, there’s been an average of 615 homes sold in PG County per month, down from the 695 per month last year, and down from the pre-COVID average in the 800s.
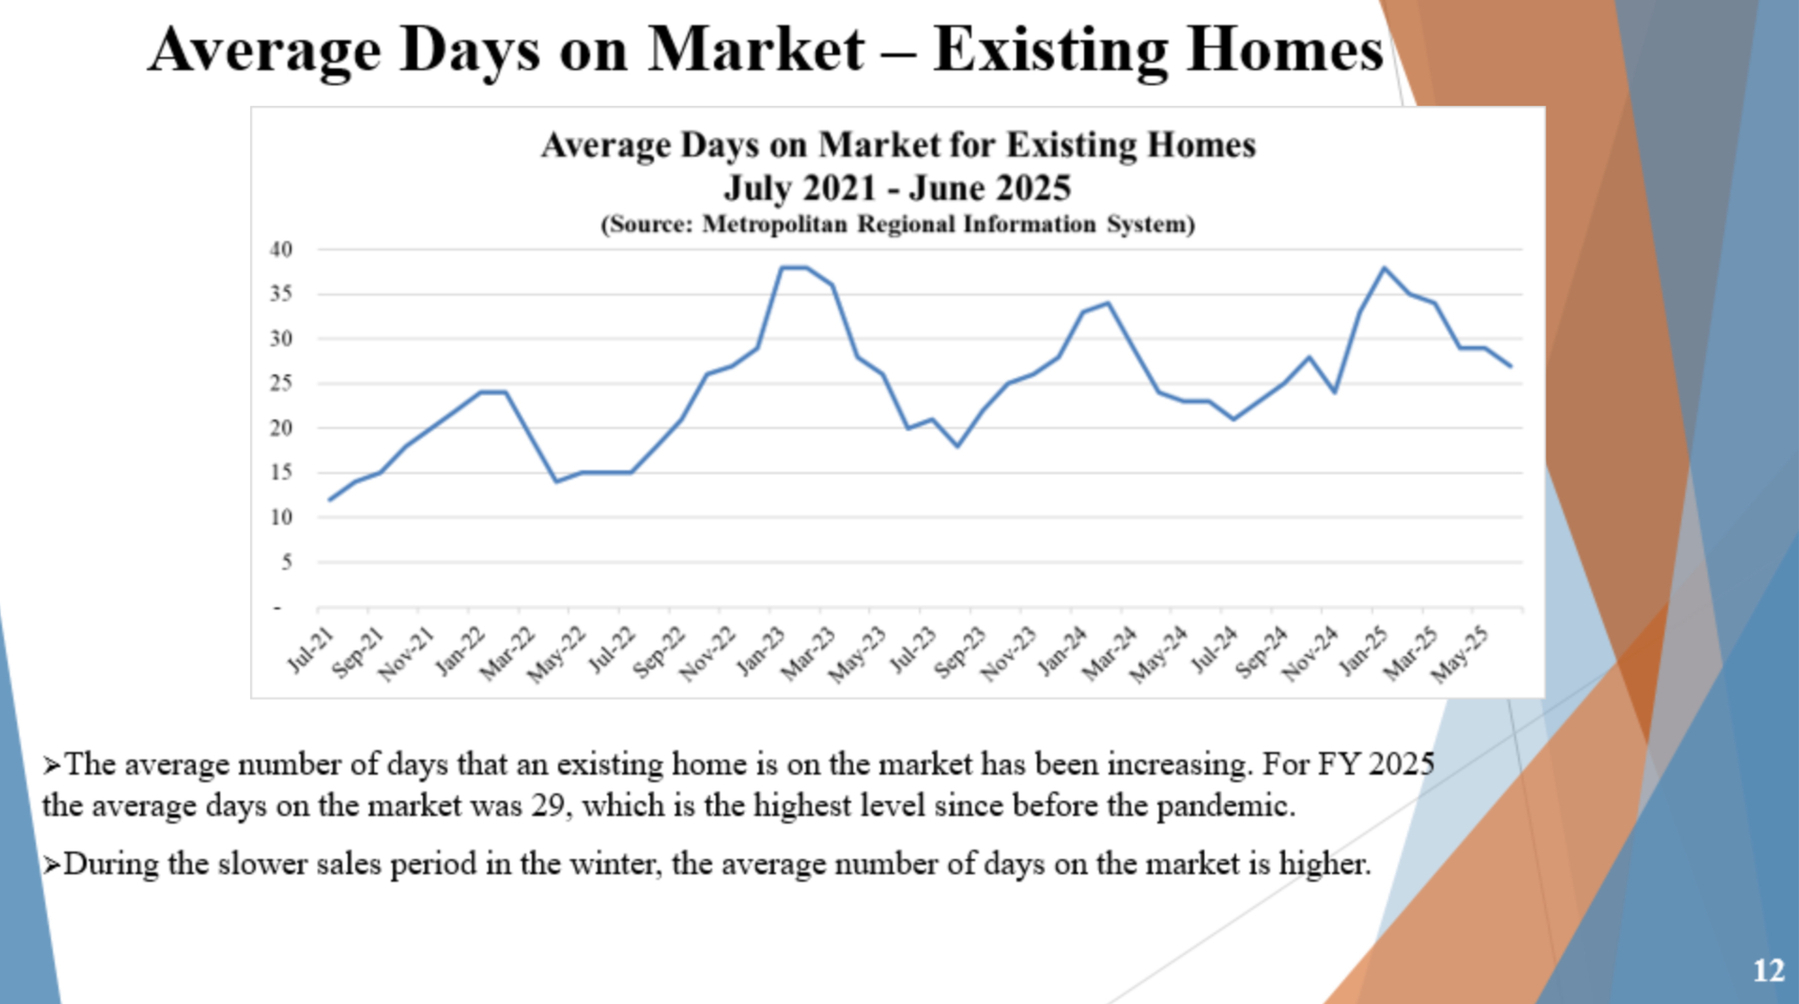
NOTE 3: As of Jun 2025, homes averaged around 27 days on the market, up from the hot market during COVID when it was as low as 12 days.
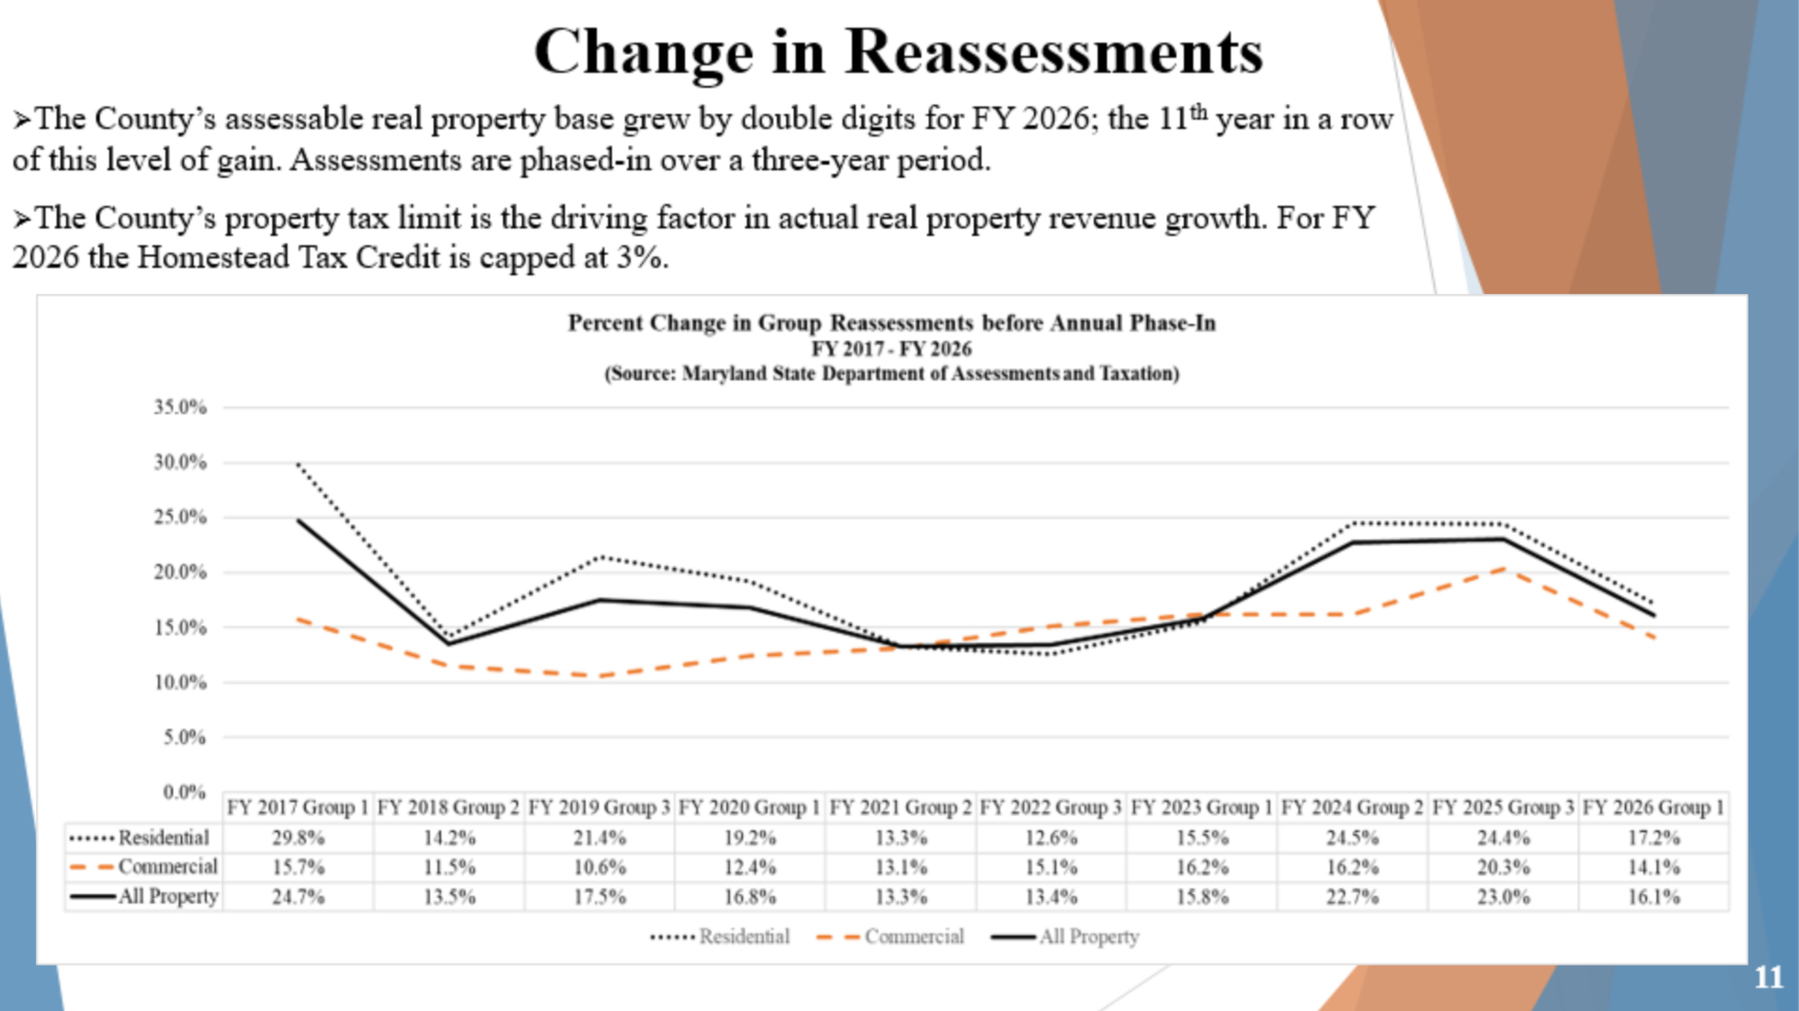
NOTE 4: PG County’s real estate tax base has been growing by double-digits for 11 years in a row, even as much as 24% in recent years. This points out the critical importance to home owners of the Homestead Credit to cap your annual increase even if your property value goes up more.
Hope you find the above interesting as well!